In your terminal
Validate, inspect and convert files, serve a local preview, and export PNG renders and SVG charts.
npm install -g @ies-tools/cli
ies inspect luminaire.ies
ies view luminaire.ldt --openIES · EULUMDAT · PHOTOMETRY
ies-tools reads the photometric files lighting manufacturers publish. It validates them, reports what they measure, converts between formats, and renders the light falling on a floor and wall from the measured intensity table.
MIT · Node and browsers · Files never leave your machine
ONE PARSER, FOUR SURFACES
Validate, inspect and convert files, serve a local preview, and export PNG renders and SVG charts.
npm install -g @ies-tools/cli
ies inspect luminaire.ies
ies view luminaire.ldt --openDrop in the 3D light viewer, polar and Cartesian intensity curves, isolux plots and an inspection panel.
import { LightViewer } from '@ies-tools/viewer/react';

<LightViewer src="/lights/luminaire.ies" />One self-contained <light-viewer> element for plain HTML, Vue, Svelte or a CMS. No framework required.
<script type="module" src="https://cdn.jsdelivr.net/npm/@ies-tools/viewer/dist/light-viewer.js"></script>
<light-viewer src="/lights/luminaire.ies"></light-viewer>Open an .ies or .ldt file to see it lit, with validation and photometric statistics beside the preview.
code luminaire.iesVS CODE EXTENSION
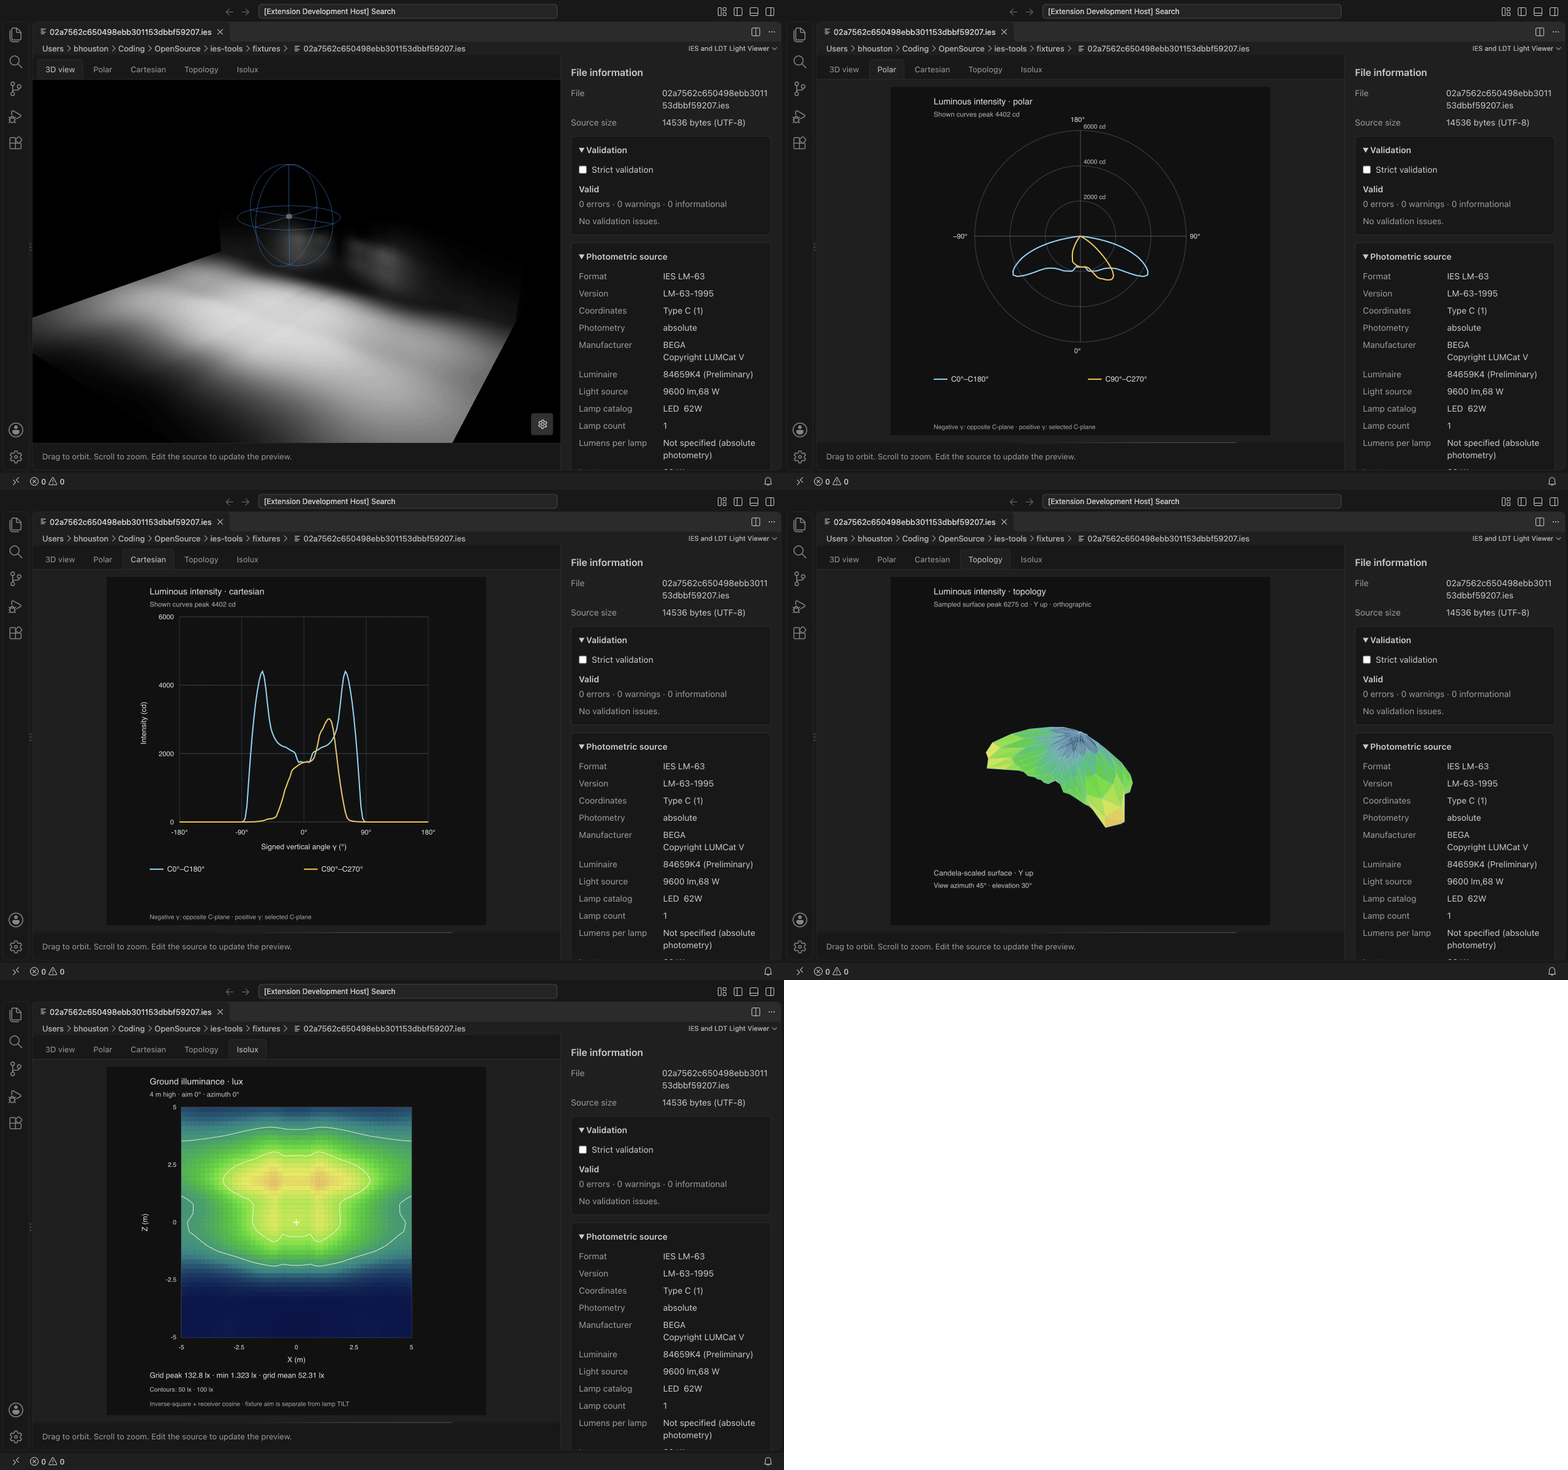
Open an .ies or .ldt file to get the same live preview beside validation results and photometric statistics. The preview refreshes as you edit the source.
MEASURED, NOT GUESSED
The viewer samples the Type C candela table in every direction, then applies inverse-square falloff and the receiving surface's cosine. A narrow spot, a wall washer and an asymmetric street light each look like what their files describe.
It renders on your GPU with WebGL2. The CLI's PNG export confirms the browser reports a hardware renderer and rejects software rasterizers, so exported images are trustworthy.
Explore the photometric graphs →A TYPED LIBRARY UNDERNEATH
@ies-tools/core has no dependencies and runs in Node and the browser. Parse a file, sample intensity in any direction, and serialize to either format.
import { parsePhotometry, sampleIntensity, serializeLDT } from '@ies-tools/core';

// IES or LDT, detected from the content
const document = parsePhotometry(text);

// Candela at γ = 30°, C = 90°
sampleIntensity(document.profile, 30, 90);

const { value, warnings } = serializeLDT(document);